
Posted To: MND NewsWireSome are saying that 2018 may be the worst year in history for wildfires in California and other states are threatened by blazes as well so Freddie Mac is reaffirming its disaster relief policies. The policies apply to borrowers with homes in Federal Emergency Management Agency (FEMA)-declared disaster areas where individual assistance programs have been made available to affected individuals and households. The options include suspending foreclosures by providing forbearance for up to 12 months and waiving penalties or late fees for borrowers with disaster damaged homes. Areas with FEMA programs are listed on FEMA’s website. Where those FEMA programs are not available, Freddie Mac servicers are empowered to use Freddie Mac’s forbearance programs to provide mortgage relief to borrowers affected…(read more)Forward this article via email: Send a copy of this story to someone you know that may want to read it.
Author: admin
Michael Ayoub, Author NMLS ID 6631
Jul 25 2018
New home sales have adopted an up and down pattern since March and continued in that trend in June. The U.S. Census Bureau and the Department of Housing and Urban Development report that those sales were at a seasonally adjusted annual rate of 631,00 units. This is down 5.3 percent from May’s revised sales of 666,000. That is a substantial downward revision from the 689,000 units and 6.7 percent increase originally reported for the month. Sales are hanging on to a 2.4 percent improvement over the June 2017 estimate of 616,000.
Analysts had expected sales to retreat but were looking for a much less definitive move. Forecasts from those polled by Econoday fell in the range of 590,000 to 685,000 units. The consensus was 668,000.
Both median and average sales prices were down for the second straight month. The median price was $302,100 compared to $315,200 in June 2017. The respective average prices were $363,300 and $370,600.
On a non-adjusted basis there were 57,000 new homes sold in June compared to 63,000 in May and 56,000 in June of last year. Sales for the year through June total 349,000, a 6.9 percent increase over the same period last year.
At the end of the reporting period there were 301,000 newly constructed homes for sale, about 8,000 more than in May. The report estimates this represents a 5.3-month supply at the current pace of sales, up from 4.7 months in June and 4.9 months a year earlier.
Sales were lower than in May in three regions but were especially strong in the Northeast. There they soared by 36.8 percent compared to May and are running 20.9 percent ahead of the same month last year. Sales declined in the Midwest by 13.4 percent month-over-month but were up 7.6 percent on an annual basis. Sales in the South were down 7.7 percent, while retaining an 8.1 percent lead over last year. Activity in the West pulled back by 5.2 percent compared to May and is now down 15.0 percent compared to June 2017.
Despite complaints about labor, lot, and material shortages, builders needed no more time to build a home last year than they did in 2016. The time did increase compared to 2015 by about two weeks. Using data from the Census Bureau’s Survey of Construction (SOC), the National Association of Home Builders (NAHB) concludes that the average time to build a single-family house was 7.5 months. The actual building time was about 6.5 months following a typical delay of around 30 days after the permit was authorized. Data from the 2015 survey showed the time from permit to completion at 7 months.
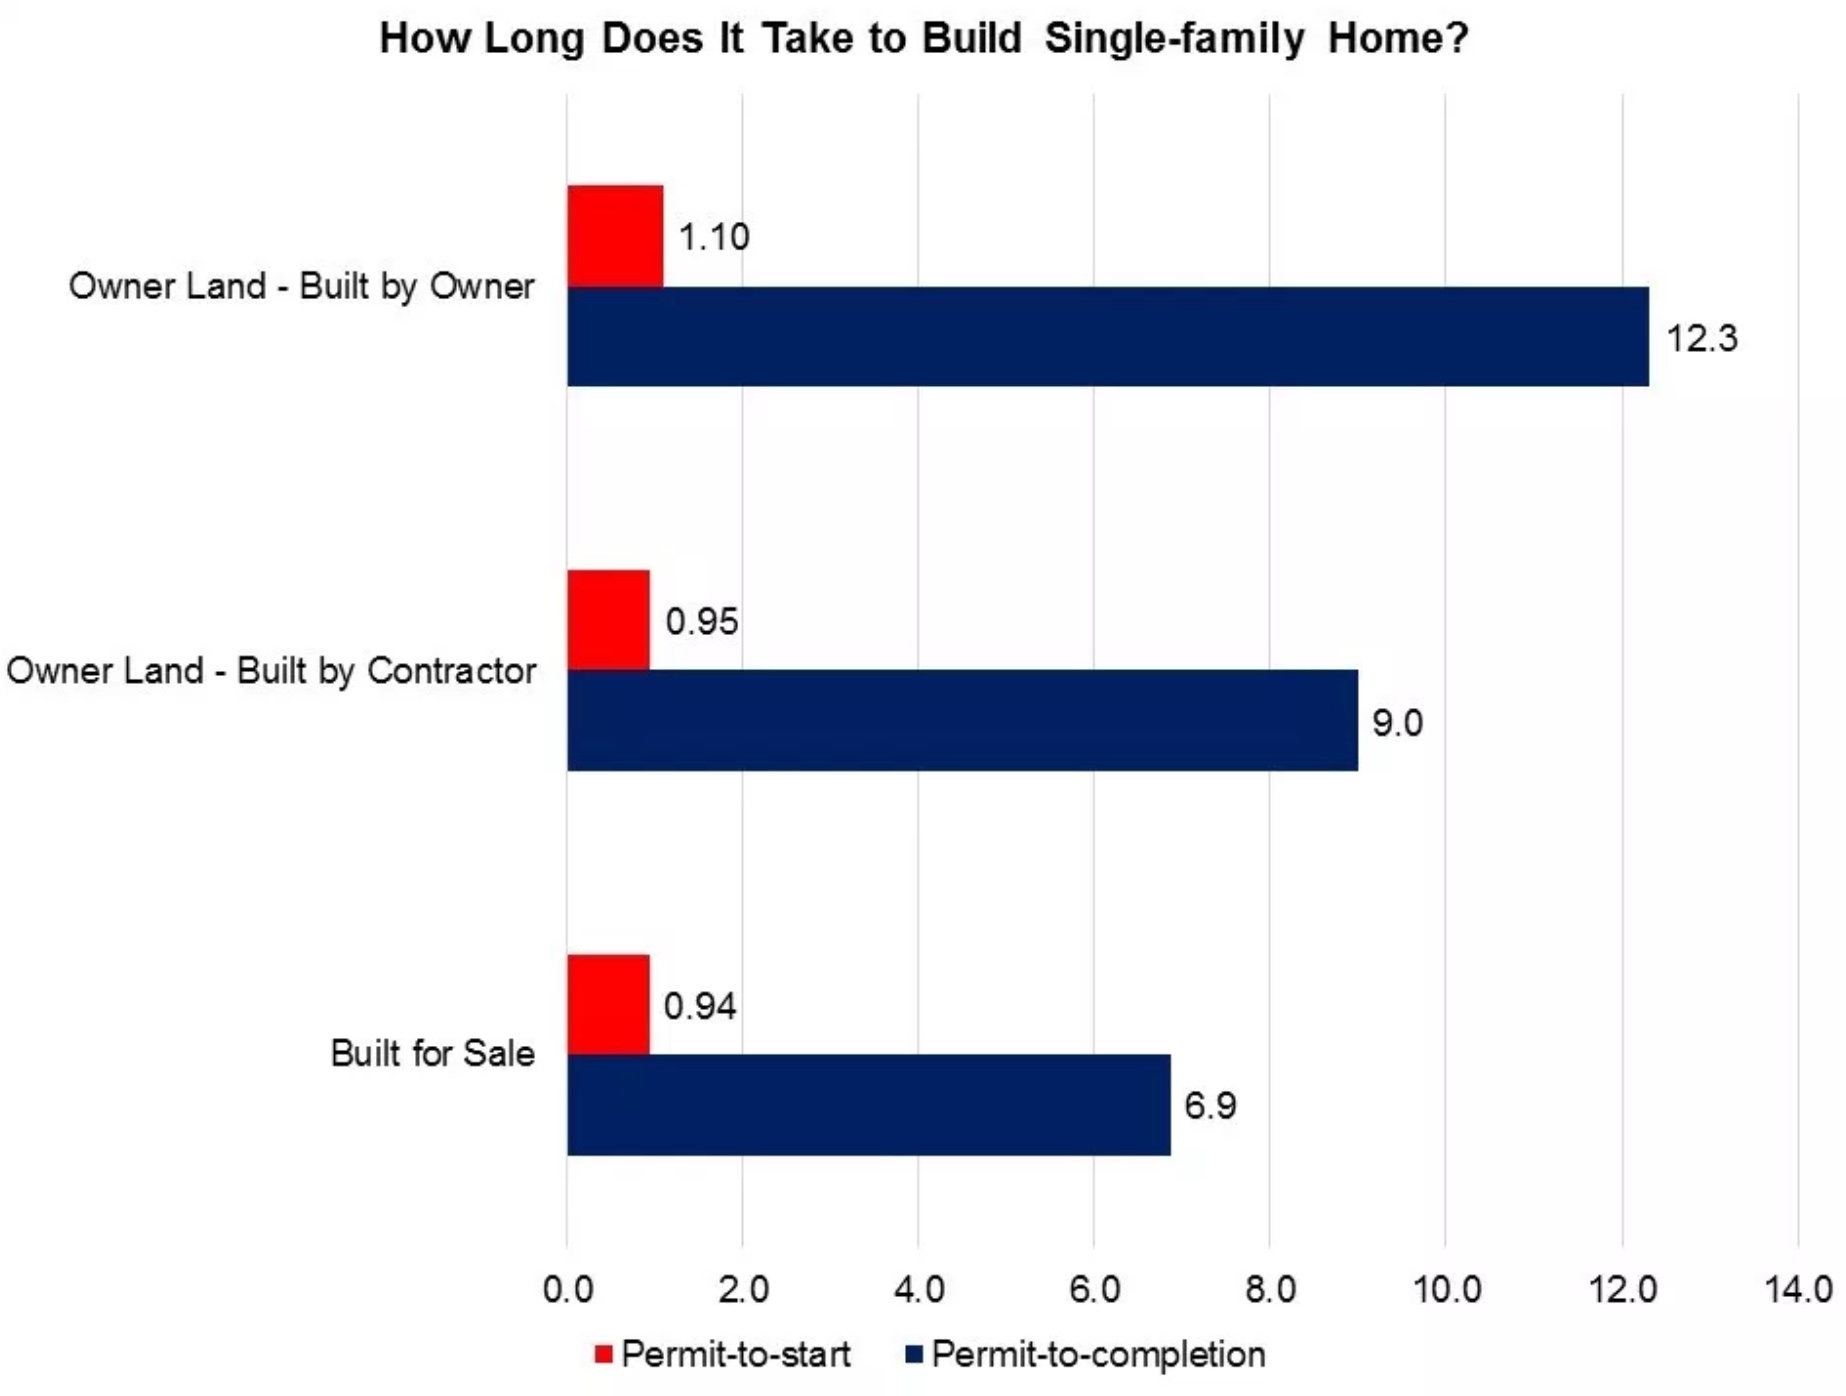
The range however is wide, from less than a month to more than 6 years. Much depends on who is building the house, for what purpose, and where.
, writing in NAHB’s Eye on Housing Blog, says that houses built for sale took the shortest time in 2017, 6.9 months from permit to completion while houses built by owners acting as their own general contractors took 12.3 months. Homes built by hired contractors were in the middle at around 9 months. Where homes were being built for sale or were custom homes built by contractors on the owner’s land, construction typically began within a month after the permit was pulled while owners overseeing their own construction had a one-month lag.
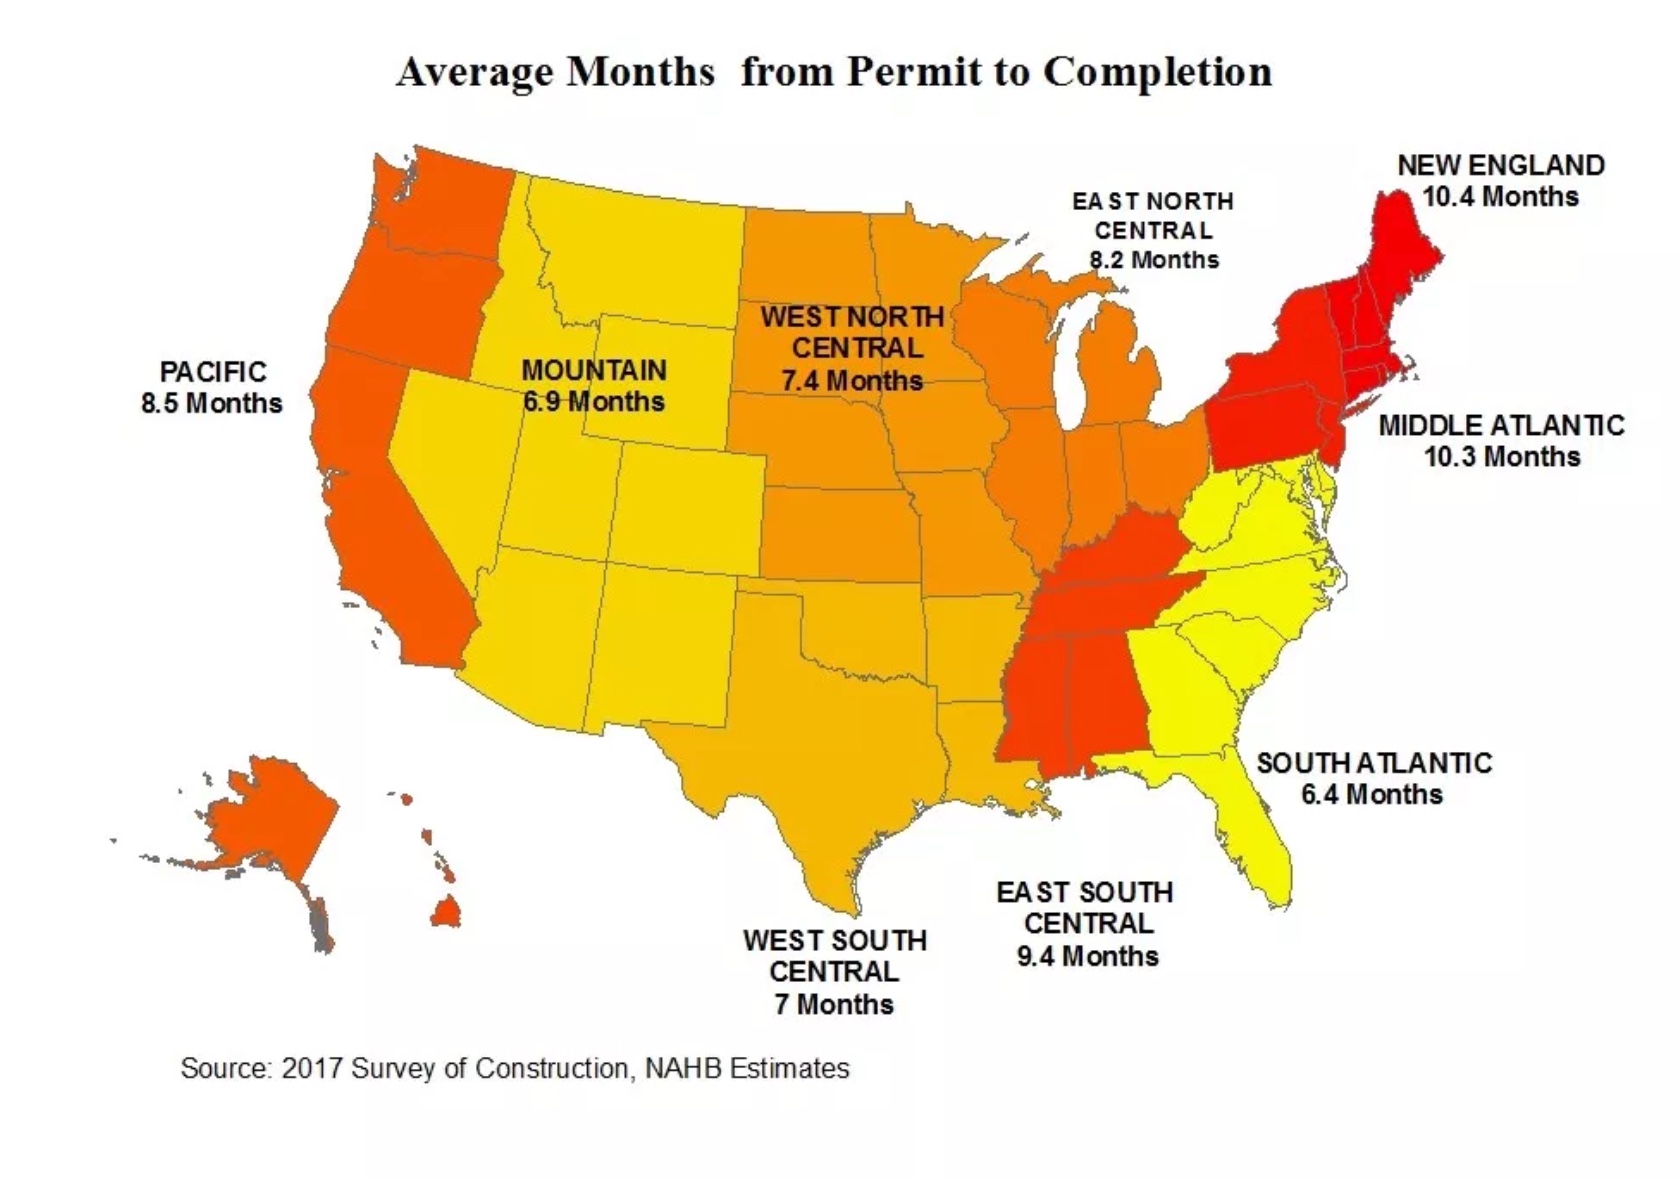
It took the longest to build a home in the New England division, 10.4 months, followed closely by the Middle Atlantic at 10.3 months. The East South Central, East North Central, and Pacific divisions also exceeded the 7.5-month national average. The shortest period, 6.4 months, was in the South Atlantic division. As to permits, the lag before construction started ranged from 17 days in the Mountain division to 39 days in the Pacific.
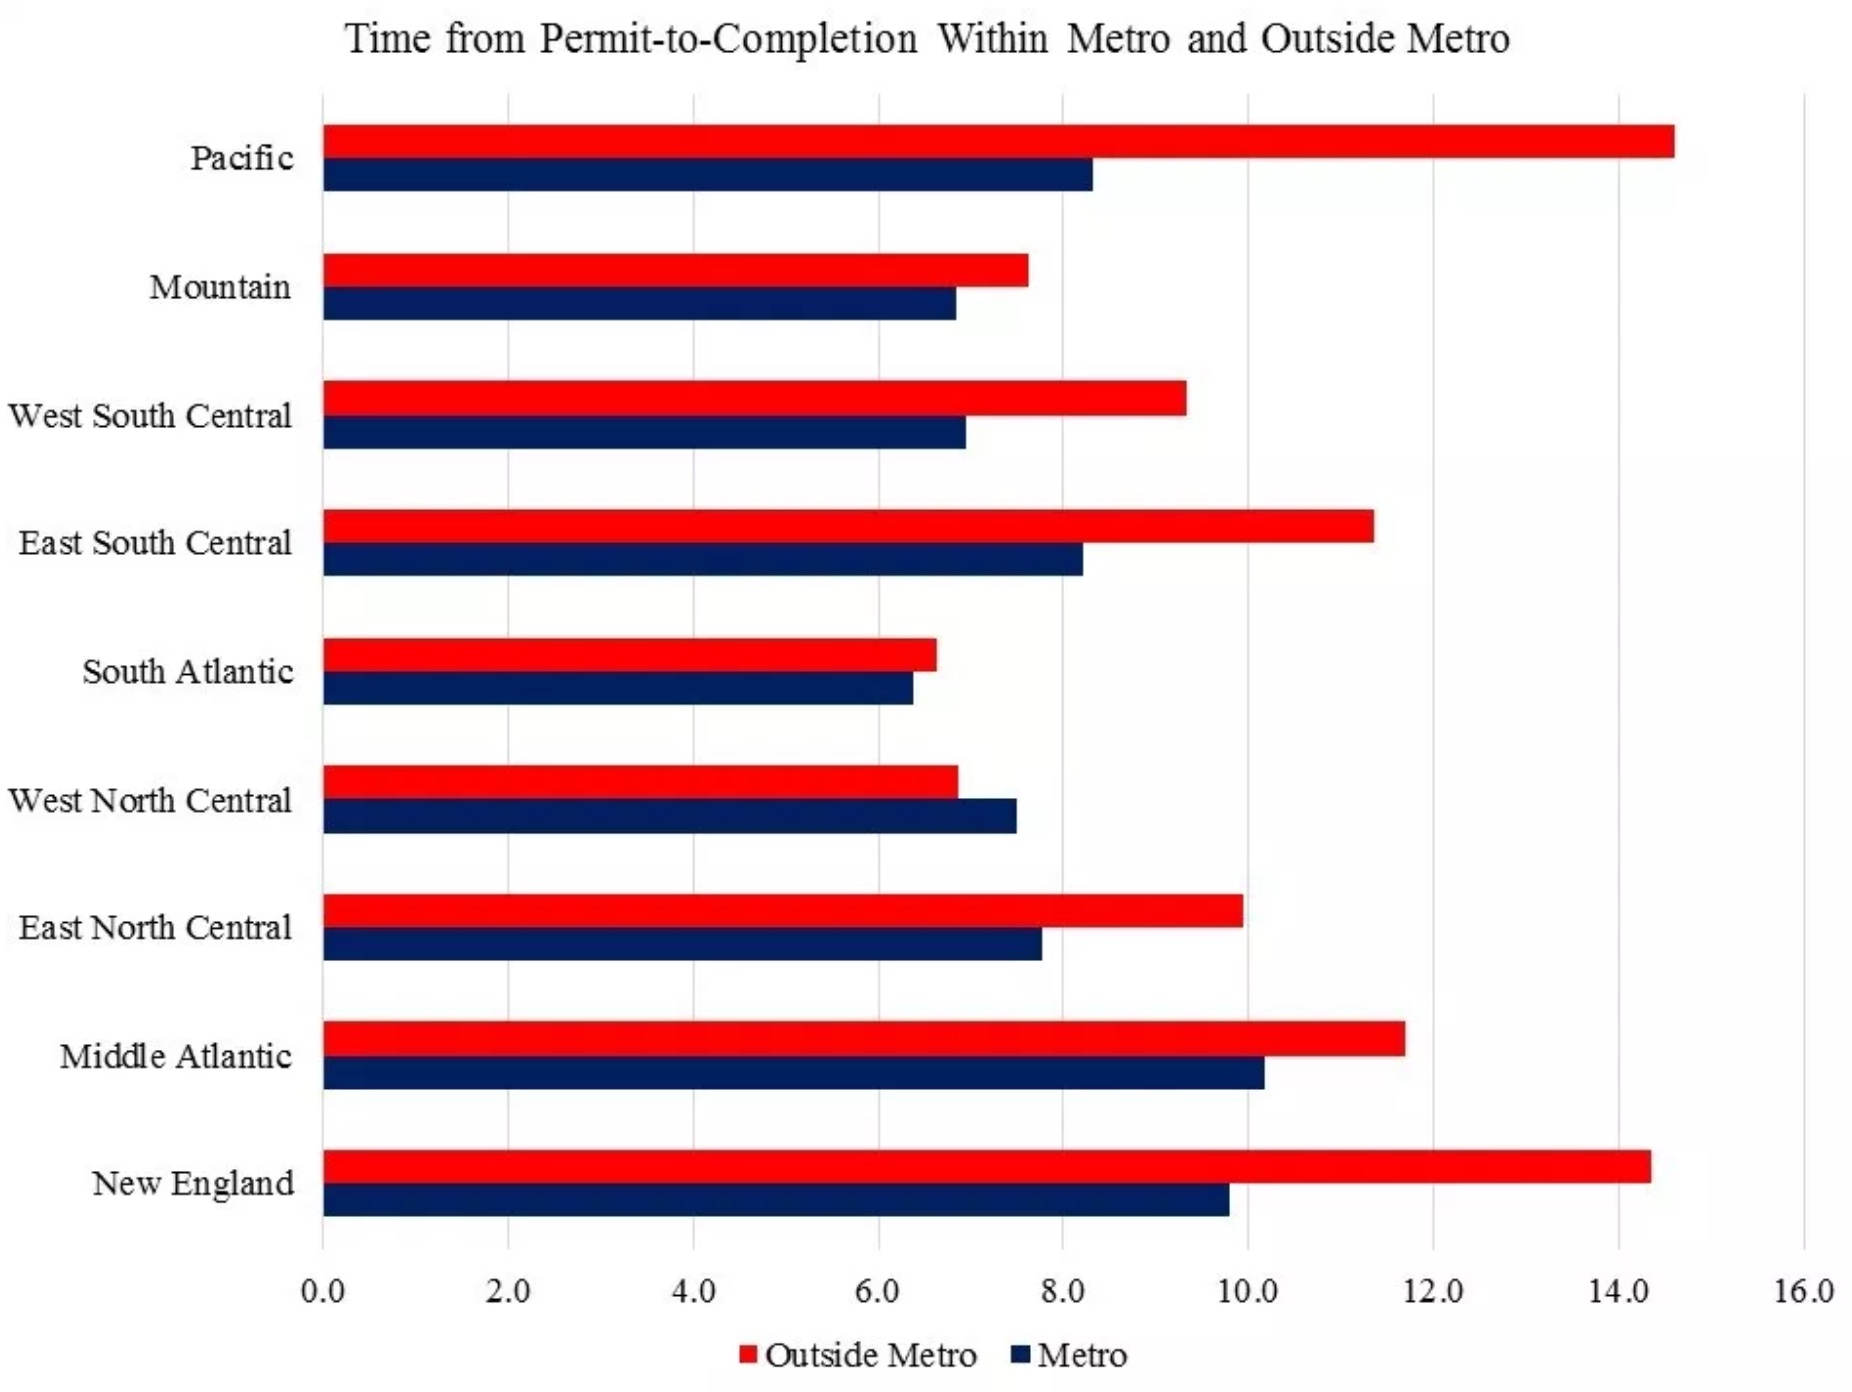
The total building time was considerably shorter inside than outside metropolitan areas, a pattern that held in all census divisions but the West North Central division. Some of the location differences were striking; with construction outside metro areas taking more than a third longer in New England and the Pacific.
The SOC also collects sale information for houses built for sale, including the sale date when buyers sign the sale contracts or make a deposit. Looking at single-family homes completed in 2017, 31.6 percent of homes were sold before construction started, 28.8 percent while under construction, 11.3 percent within a month of completion, and 16.6 percent sold after completion. The percent of single-family houses completed in 2017 and remaining unsold as of the first quarter of 2018 was 11.6 percent.
Jul 16 2018, 5:43AM
Categories