
201401_cfpb_booklet_charm
Category: blog
Categories
Home Loan Toolkit
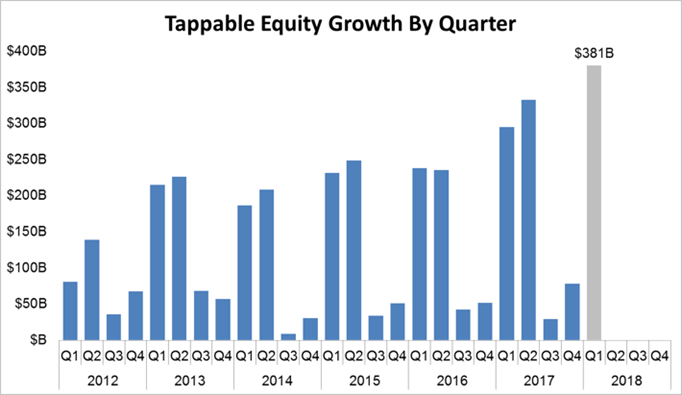
Americans are sitting on a nearly unprecedented level of untapped wealth – or maybe sitting IN it is more to the point. A report from Black Knight notes the first quarter of this year saw the “tappable” equity Americans have in their homes rose at what could be a record pace. The company says tappable equity growth is a different metric than simple equity growth as it is the amount that homeowners can actually use. That is, it is the amount of a home’s value that can be borrowed against before reaching a combined loan-to-value (CLTV) ratio of 80 percent.
Tappable equity grew by $380 billion in the first quarter of 2018. That 7 percent increase is the largest single quarter growth in Black Knight’s records, which go back to 2005. Equity growth is usually greatest in the first and second quarters of each year, but the first quarter growth this year was nearly 30 percent greater than the same quarter in 2017. And, as the chart below shows, second quarter growth has exceeded first quarter growth for five of the last six years.
Homeowners nationwide have a total of $5.8 trillion in tappable equity and that number has increased by 16.5 percent or $820 billion over the last 12 months. The total is the highest ever recorded and is 16 percent higher than at the previous peak of home prices in mid-2006.
Another report earlier this month, this one from CoreLogic put total equity at $15 trillion. This was an increase of $544 billion during the first quarter and $544 billion year-over-year.
This equity growth is, or course, being driven by rising home prices. Black Knight puts that growth at 2.5 percent in just the first three months of this year. This works out to an increase of $6,900 for the median priced home in the first quarter and $14.700 compared to the first quarter of 2017. The average homeowner has $113,900 in tappable equity. As we will see in a minute however, those averages are misleading.
A decline in LTV’s also plays a role; the national average is now 52 percent. CoreLogic pointed out that the growth in mortgage debt turned negative in 2008 and remained so until 2015 and has increased only slowly since then. From the first quarter of 2017 to the first quarter of this year it grew by $280 billion, much more slowly than home values. It is now estimated at $10.1 trillion.
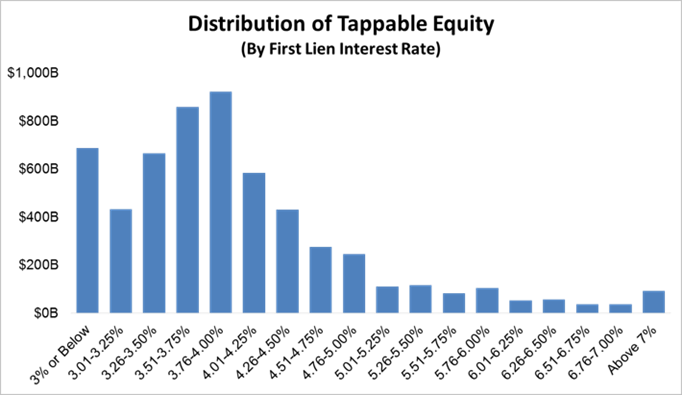
Black Knight says nearly 70 percent of the equity gain in the first quarter is tappable, assuming a cap of 80 percent in combined CLTV. However, there is a significant disincentive for equity-rich homeowners to refinance. Nearly 80 percent of the total tappable equity is held by homeowners who hold first mortgages with interest rates below 4.5 percent and 60 percent is held by homeowners whose mortgages rates are below 4.0 percent.
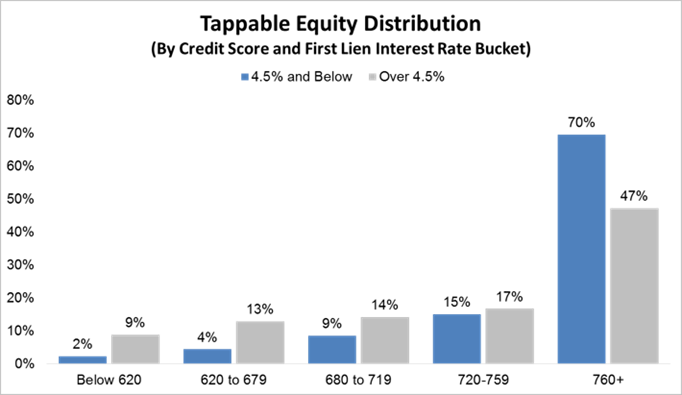
This should be an attractive market for lenders’ offering home equity lines of credit or HELOCS. Not only do these homeowners have significant equity and first mortgages they may be reluctant to give up, but 70 percent of homeowners with interest rates below the current levels have credit scores above 760.
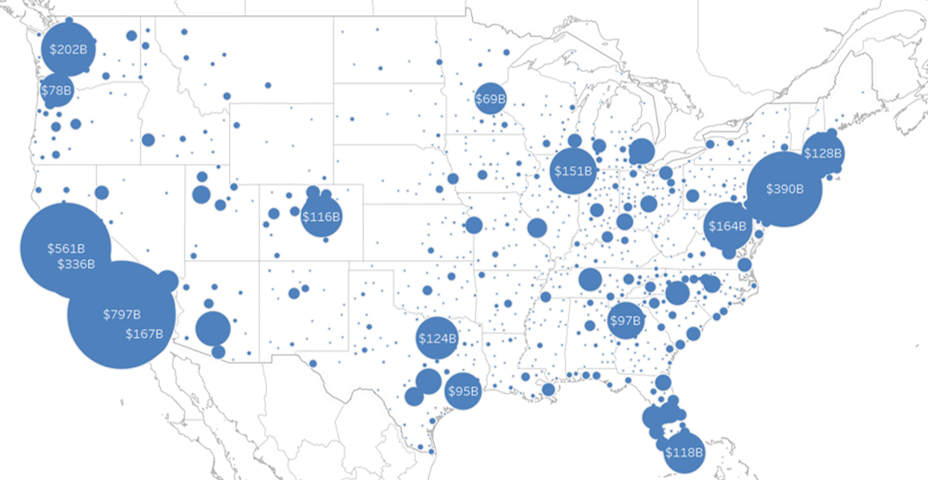
However, as stated earlier, the wealth represented by increasing equity is very unequally distributed. San Jose, for example, has seen the average mortgaged home gain $191,500 in tappable equity in the last year, more than twice the average in any other market. The metro area is estimated to have the 4th largest pool of such equity in the country, $336,000 billion, despite being the 34th largest metro in population. The average per mortgaged homeowner is $695,000.
As can be seen from the map below, several other California cities as well as other area on both coasts, in Texas, and a few in the Midwest have benefitted disproportionately from the rise in equity, while in most parts of the country there have been considerably lower gains, or none at all.
Jun 17 2018, 10:52AM
Categories
Could The Top Already Be In For Rates?
(Most of this newsletter lays out a counterpoint to the fairly dominant theme of “higher rates in 2018.” Please note: this is just the bright side of the debate. There’s still a dark side, but we’re giving it the week off for Spring Break!)
It’s no secret that late 2017 and early 2018 were anything but pleasant for fans of low rates. Average mortgage rates and Treasury yields shot higher at their fastest pace since the 2016 presidential election. Even after that spike, there are still plenty of reasons to fear rates may continue higher, and that’s exactly why they could go lower.
The emphasis is very much on “could.” At the risk of bursting any bubbles, rates “could” always move higher or lower from wherever they are right now, and traders are constantly trying to adjust today’s rates to reflect future probabilities. In other words, whatever can be accurately known about the future is generally already priced-in to current rate levels. This is actually the foundation of our rate-friendly narrative this week, but first, let’s recap the data and market movement.
Housing-Related Data Recap
The National Association of Realtors reported a 3.1% improvement in Pending Home Sales, a measurement of home purchase contract activity. This follows a 5% decline in the previous month and helps to contain the year-over-year declines seen in the lower section of the following chart.
The Mortgage Bankers Association released its weekly update on mortgage applications, which showed another nice gain for purchases and a token improvement for refis. The good news is that we haven’t even hit peak season for purchase apps (June). When we do, the numbers should be even better.
Persistent homebuying demand + low inventory = higher and higher prices. The Case-Shiller price index echoed other recent home price reports with a move up to 6.4% for January–not quite as high as FHFA’s January numbers, but 0.2% higher than was forecast for this report. Moreover, in seasonally-adjusted terms, this week’s “20-city price index” hit new record highs.
Market Movements and Rate Outlook
Rates dropped at their fastest pace of the year* this week, and for the 3rd week in a row! That makes 6 out of the past 7 weeks with rates closing at lower levels than the previous week. Granted, some of those victories involved rates essentially remaining flat, but after the rapid spike earlier in the year, we’ll take any victory we can get!
Because financial news outlets are decidedly stock-focused, much of the available commentary on rates ends up involving stocks. The conventional wisdom seems to be that heavy losses in stocks get credit for noticeable declines in rates. There is SOME truth to this, but the correlation guaranteed.
In fact, the biggest moves tend to happen when rates are doing their own thing. For instance, in the chart below, the big drop at the beginning of 2015 was due to the onset of the European Central Bank’s bond buying program (more bond-buying = lower rates). The big spike in late 2016 was due to bond traders fearing increased Treasury issuance (more supply = more to sell = higher rates) after the election. And if all that isn’t enough to hammer home the fact that stock/rate correlation varies quite a bit, just use the lower pane of the chart to re-calibrate your assumptions as needed.
Since the previous chart offered 2 good examples of bonds/rates doing their own thing regardless of the stock market, what might turn out to be the current motivation for the next big move? Interestingly enough, stocks could actually play a pretty big role this time. The higher they’ve gone, and the longer they’ve gone without a bear market, the greater the fear of a massive correction. Most analysts would agree that February and March would end up looking like a small warning shot relative to such a correction. To whatever extent that drama begins to unfold, rates couldn’t help but improve simply because so much money from the stock market would be seeking safe havens.
Were I to argue against the “safe haven” idea, I would point out that the current environment is not conducive to rates moving lower for two, maybe three big reasons:
1. Fed rate hike expectations suggest short-term rates will be high enough in the future that long-term rates (the stuff we care about in the mortgage/housing market) will have to go somewhat higher.
2. Increased government bond issuance (to pay for stuff like infrastructure and the tax bill) will create more and more supply. Higher bond market supply = higher rates.
3. Fiscal policies may promote additional economic growth and inflation–both of which are traditionally bad for rates.
All of the above points are valid, but there’s one important counterpoint back on the optimistic side of the rate argument, and it goes back to the beginning of the newsletter: “whatever can be accurately known about the future is generally already priced-in to current rate levels.”
With that in mind, anything that impacts the accuracy of the outlook creates opportunities for rates to do “something different.” Uncertainty about the true cost of the tax bill over time means uncertainty about how much debt will be issued to pay for it. If the tax bill actually ramps up revenues as much as some of its proponents think it might, bond markets likely overestimated the government’s future borrowing needs. And again, anything that decreases those borrowing needs is a net-benefit for rates.
Bottom line: adjusting for the effects of the tax bill presented a moving target for bond markets. At the same time, traders were also adjusting to a slightly accelerated Fed rate hike outlook. The juxtaposition of these 2 themes advocated caution among traders. Because of that, it made more sense to push rates higher first and ask questions later.
Now, those questions might be starting to get asked. Did we assume a worst-case scenario for Treasury issuance without planning on much relief from revenues? Is the Fed really going to end up hiking as fast as their forecasts indicate? With the tax bill effects already priced in, any rethinking of Fed rate hike expectations is more free to have a positive effect on today’s longer-term rates. We may already be seeing signs that the trajectory is leveling off (lower pane of the following chart).
*One final caveat for mortgage rates specifically. This one is a blessing and a curse. On the one hand, mortgage rates have been much less volatile than Treasury yields recently. On the other hand, keep in mind that mortgages don’t tend to benefit as quickly when bond markets are improving overall. If Treasury yields continue lower, mortgages will eventually follow, but it will take time, and the gains will need to stabilize for weeks before lenders begin to close the gap.
National Average Mortgage Rates
Rate Change Points
Mortgage News Daily
30 Yr. Fixed 4.51% -0.01 0.40
15 Yr. Fixed 3.89% -0.01 0.40
30 Yr. Jumbo 4.54% -0.01 0.00
Freddie Mac
30 Yr. Fixed 4.44% +0.49 0.50
15 Yr. Fixed 3.90% +0.59 0.50
5/1 ARM 3.66% +0.45 0.40
Mortgage Bankers Assoc.
30 Yr. Fixed 4.68% -0.01 0.46
15 Yr. Fixed 4.12% +0.05 0.51
30 Yr. Jumbo 4.55% 0.00 0.37
Rates as of: 3/28
MBS and Treasury Market Data
Price / Yield Change
MBS FNMA 3.5 100.20 +0.20
MBS GNMA 3.5 100.94 +0.17
10 YR Treasury 2.7407 -0.0418
30 YR Treasury 2.9729 -0.0485
Pricing as of: 3/29 1:48PM EST
Recent Housing Data
Value Change
Mortgage Apps Dec 27 368.6 -2.8%
Building Permits Jul 1.22M -4.08%
Housing Starts Jul 1.16M -4.78%
New Home Sales Jul 571K -9.37%
Existing Home Sales Jul 5.44M -1.27%
Builder Confidence Aug 68 +6.25%
CONTACT ME
• – www.cranbrookloans.com
• – Cranbrook Loans
• – Michael Ayoub
• – 586-649-2350
Feb 15 2018, 12:32PM
While the prospect of Fannie Mae and Freddie Mac needing taxpayer money conjures up images of a failing mortgage market requiring a government bailout, that’s very far from the case this time around. In fact, taxpayers continue to come out way ahead with respect to the GSEs’ conservatorship agreement, even after the draws that will be needed to cover 4th quarter losses. At issue are one-time write-downs arising from accounting changes in response to the new tax bill. After this, it should be business as usual (a business that has been returning a significant amount of money to US taxpayers).
Both Freddie Mae and Fannie Mae posted strong full-year incomes for 2017 despite that both also suffered fourth quarter losses courtesy of the new tax law. Fannie’s comprehensive income was $2.5 billion after a loss of $6.7 billion in the fourth quarter. Freddie Mac’s numbers for the two respective periods were $5.6 billion and a $3.3 billion loss.
Fannie Mae said its full-year results were down from $12.3 billion for all of 2016 although its 2017 pre-tax net was higher, $18.4 billion versus 18.3 billion. The $6.5 billion net loss for the quarter was down from net income of $3.0 billion in Quarter 3.
The fourth quarter loss was the result of a remeasurement of the company’s deferred tax assets due to the enactment of the Tax Act. The result was a one-time $9.9 billion provision for federal income taxes.
Fannie Mae had net revenues of $5.5 billion in the fourth quarter compared to 6.5 billion in the third. Full-year revenues were $23.0 billion, compared to $22.3 billion a year earlier. Net income from interest declined for both the fourth quarter and the year because of a decline in income from the company’s retained mortgage portfolio. The loss was offset for the year by a substantial increase in fees and other income.
In December, the company’s conservator, the Federal Housing Finance Agency (FHFA) reached an agreement with the Treasury Department to modify the dividend provisions of the senior preferred stock agreement to allow Fannie Mae to increase its capital reserve amount to $3.0 billion and reduce the dividend amount otherwise payable for the fourth quarter by $2.4 billion. Further, the company said it expects FHFA to submit a request to Treasury on the company’s behalf for $3.7 billion to cover the quarter’s deficit.
Fannie Mae said it provided approximately $570 billion in liquidity to the mortgage market last year and was the largest issuer of single-family mortgage related securities in both the fourth quarter and the year, with a market share of 39 and 37 percent respectively. It also provided more the $67 billion in multifamily and other rental financing and supported 770,000 units of multifamily housing during the year.
Freddie Mac posted net interest income of $3.5 billion during the fourth quarter and $14.2 billion for the year. Third quarter interest income was slightly under 3.5 billion, while the full-year income in 2016 was $14.4 billion.
Freddie Mac wrote down $5.4 billion in net deferred assets because of the tax law. This loss was partially offset by a $2.9 billion after-tax liquidation settlement received in the third quarter. The company will also draw on its Treasury line to cover its fourth quarter net deficit and expects to borrow $0.3 billion. This will reduce the amount remaining under its stock agreement to $140.2 billion.
The company said its guarantee portfolio grew by 6 percent during the year, the highest growth rate in the past ten years, and exceeded $2 trillion for the first time. The single-family guarantee portfolio grew 4 percent and the multifamily guarantee portfolio increased by 28 percent.
Despite the shortfall in their fourth quarter results, both companies said they expect the new tax law to benefit them going forward. Fannie Mae estimates it will be henceforth be paying taxes at a 20 percent rate.
The company’s CEO, Donald H. Layton said, “We now have a fully competitive company that is executing on its mission, protecting taxpayers and helping to build a better housing finance system for the nation.”
Revisiting Stellar Home Sales and Tax Bill’s Effect on Housing
| Weekly Newsletter |
Dec 29, 2017 3:37 PM ET
There were several interesting developments with relevance to the housing market last week. Rather than let important information fall by the wayside amid the holiday season, this week’s newsletter will largely be a reprint of last week’s. Interest rate discussion is updated to reflect this week’s changes, as is the calendar of economic reports and the list of additional news stories. In order to see the economic calendar or news links in the previous newsletter, you can view it directly.
The tax bill that has been at the center of discussion for the Housing Market was officially signed into law last week. In the days leading up to that, both New and Existing Home Sales surged to post-crisis records. Can the new tax policies coexist with a strong housing market?
In a word: yes. While there were some provisions in earlier drafts of the tax bill that would have made this question harder to answer, they didn’t make the final cut. Specifically:
- Capital Gains on Sale of Primary Residence. As long as you’ve lived in your primary residence for any 2 of the past 5 years, you can still exclude capital gains on the sale of that home, up to $500,000 for joint filers ($250k otherwise). As recently as last week, the bill would have changed that time requirement to 5 of the past 8 years–something that could have greatly inhibited housing turnover.
- Mortgage Interest Deduction. In the initial draft of the bill, interest would have only been deductible on the first $500k of your loan balance. That number rises to $750k in the final bill (still lower than the 2017 limit of $1m). Any “acquisition indebtedness” (debt that can be traced back to the purchase of the home) that existed or that was under contract to exist as of 12/15/2017 will continue to enjoy the $1m limit. This applies to refinances as well, as long as the new loan is only refinancing acquisition indebtedness. To be clear, that means you cannot write off additional interest that results from a cash-out refinance. Interest on Home Equity Lines of Credit (HELOCs) is no longer deductible, even on existing HELOCs, except those used as purchase money (up to $100k).
- State and Local Taxes. An initial draft of the bill completely killed state and local tax (SALT) deductions, including those for property taxes. The final bill added $10k back. This might seem like plenty, but in some states, like New Jersey, it’s only slightly above average for property taxes alone! In states with a high combination of income and property tax, this $10k limit could have some effect on homebuying decisions, but it would have to be considered against the much larger “standard deduction.” Many taxpayers that had been itemizing deductions in these areas are now expected to opt for the standard deduction.
All in all, this is a storm that the housing market can weather. It’s ability to do so was only reinforced by EXCEPTIONALLY strong sales figures this week. New Home Sales stood out as the biggest winner, rising a whopping 17.5 percent in November. This isn’t merely good in the “post-crisis” context. It puts New Home Sales back in a “high average” historical range.

Existing Home Sales may not have surged quite as much as New Home Sales, but they too hit post-crisis highs. Moreover, they’re in a much stronger spot in the context of the historical trend. The chart below shows plenty of room to weather any effects from new tax policy without exiting a healthy growth trend.

Construction metrics (Housing Starts and Building Permits) weren’t quite as balmy as the sales data, but positive trends remained decisively intact.

With respectable construction activity and home sales booming, it’s no surprise to see builder confidence also exploring a new post-crisis high. In fact, more than any of the week’s other housing-related reports, the NAHB Housing Market Index did the most to return near all-time highs. This should be taken with a grain of salt, however, due to the nature of survey data, which tends to oscillate in a steadier range when compared to something like outright sales counts.

Other than the uncertainties surrounding the tax bill, the only other cloud on last week’s horizon was a fairly abrupt increase in mortgage rates. This resulted from the uncommonly light trading environment that exists at the end of December (and NOT from the tax bill).
The yield curve (the spread between longer and shorter-term rates, such as 10yr and 2yr Treasury yields) has been a key consideration for traders in 2017. Last week’s rate spike was immediately preceded by a bounce at a post-crisis record low for the 2yr vs 10yr yield curve.
“Uncommonly light trading environments” work both ways, thankfully, simply because they amplify the effects of imbalances (rates move more than they otherwise would). This week, the imbalance was in our favor. The yield curve returned to those long-term lows and rates followed. As such, we’re set to begin January with rates well-within their range from Q3-2017.

Recently Released Economic Data
| Time | Event | Period | Actual | Forecast | Prior |
|---|---|---|---|---|---|
| Tuesday, Dec 26 | |||||
| 9:00 | CaseShiller 20 yy (% ) | Oct | 6.4 | 6.3 | 6.2 |
| 9:00 | CaseShiller 20 mm nsa (%) | Oct | 0.2 | 0.4 | 0.4 |
| Wednesday, Dec 27 | |||||
| 10:00 | Pending Home Sales (%) | Nov | 0.2 | -0.4 | 3.5 |
| 10:00 | Pending Sales Index | Nov | 109.5 | 109.3 | |
| 10:00 | Consumer confidence | Dec | 122.1 | 128.0 | 129.5 |
| Thursday, Dec 28 | |||||
| 8:30 | Jobless Claims (k) | w/e | 245 | 240 | 245 |
| 9:45 | Chicago PMI | Dec | 67.6 | 62.0 | 63.9 |
Upcoming Economic Data
| Time | Event | Period | Forecast | Prior | |
|---|---|---|---|---|---|
| Wednesday, Jan 03 | |||||
| 10:00 | ISM Manufacturing PMI | Dec | 58.2 | 58.2 | |
| Thursday, Jan 04 | |||||
| 8:15 | ADP National Employment (k) | Dec | 190 | ||
| 8:30 | Jobless Claims (k) | w/e | 240 | 245 | |
| Friday, Jan 05 | |||||
| 8:30 | Non-farm payrolls (k) | Dec | 187 | 228 | |
| 8:30 | Unemployment rate mm (%) | Dec | 4.1 | 4.1 | |
| 10:00 | ISM N-Mfg PMI | Dec | 57.6 | 57.4 | |
| 10:00 | Factory orders mm (%) | Nov | 1.4 | -0.1 | |
Event Importance:
No Stars = Insignificant | Low | Moderate | Important | Very Important
Categories
Newsletter 12212017
| Calmer Day, But It Still Confirms a Weaker Trend |
| By: Matthew Graham
Today was much calmer than yesterday in terms of intraday volatility. The overall trading ranges in 10yr yields and MBS were more than twice as narrow. But in each case, those ranges occurred almost completely outside yesterday’s ranges… on the unfriendly side. In other words, compared to yesterday’s 2.39-2.47 range in 10yr yields, today’s was 2.44-2.50 (through the 3pm close). The takeaway is that yesterday’s break outside the consolidative trend we’ve been following for months is “confirmed” from a technical analysis standpoint. Momentum indicators are in agreement, and lender rate sheets are in the worst shape in months. The only caveat is that late December can see trading occur in its own vacuum, ultimately with little bearing on momentum in the following year. Obviously, we can’t know if that’s going to be the case this time around. All we can know is that the current trend is not friendly, and that it makes sense to assume that trend remains intact until it’s defeated. Once again, there was nothing to be gleaned from today’s data and events. None of them had any discernible impact on bond trading. Furthermore, the timing of volume spikes suggests–if not confirms–that all the movement is a byproduct of year-end trading and the squaring of major trading positions in 2017. More simply put, this is just how traders are trading right now, and it’s not a result of anything that’s happened over the past 2 days. |
Categories
daily newsletter
Categories
Loan Risk Table
This table shows the risk level to lenders based on the loan balance compared to your homes value. For example if you apply for a 50k loan and the home is worth 100k the loan to value ratio would be 50% and would be considered extremely low risk.

The credit score risk table shows the risk level to the lender based on your credit score.
By Kenneth R. Harney August 26
If you’ve got a low FICO credit score but believe you can handle monthly mortgage payments instead of rent, here’s some potentially good news: The government is willing to give you a better shot at obtaining a low-down-payment home loan from the Federal Housing Administration.
Under a key policy change that took effect last week, lenders nationwide have more leeway to approve mortgages to borrowers who qualify under FHA’s underwriting guidelines but may have below-par FICO scores. Some analysts say the revised approach could create a pathway for as many as 75,000 to 100,000 new loans a year to borrowers who are now frozen out of consideration.
FICO credit scores run from 300, considered the highest risk of default, to 850, the lowest risk. Though FHA for years has accepted applicants who have FICO scores in the 500s, the practical reality has been that most lenders ignore borrowers whose scores are under 620 or even 640. Lenders have avoided low-FICO borrowers in large part because FHA itself has employed a statistical evaluation system that scrutinizes — and sometimes severely penalizes — banks and mortgage companies that make what FHA considers too many “high-risk” loans compared with other lenders active within the same geographic area.
Under the revised policy, lenders will be judged under a fairer metric. This will allow companies located in communities with large concentrations of people with below-average FICO scores — these people tend to include young, first-time buyers, minority households and moderate-income working families — to make loans without fear of being penalized solely because of their business focus.
[Ken Harney: Already full of complications, closings may soon grow even more worrisome]
“This is going to really open the doors — I think it’s a huge step in the right direction,” says Clem Ziroli Jr., president of First Mortgage Corp. in Ontario, Calif. “There are a lot of people out there who have good credit but low FICO scores simply because they lost their jobs during the recession” and got behind on paying bills. “They are working two jobs. They’ve been slowly rebuilding their credit and have been saving money for a down payment. They are good risks” — they’re not going to mess up on mortgage payments. Equally important, Ziroli told me, they are eager “to build wealth by owning a home” rather than paying rent to a landlord. Ziroli’s company originates roughly 7,000 FHA-insured loans a year, many to Latino and African American first-time buyers.
David H. Stevens, president and chief executive of the Mortgage Bankers Association and a former head of the FHA, says the revised policy should help some borrowers whose FICO scores in the low 600s and upper 500s have barred them from obtaining any type of mortgage, FHA or otherwise. But those who fully qualify under FHA’s regular underwriting standards — reliable income, acceptable debt-to-income ratios, solid ability to repay — “will now be more likely to find some lenders who will do their mortgages.”
That’s significant, he said. Even so, many lenders will not rush in and immediately start doing more low-FICO loans. They’re going to wait and watch how FHA treats lenders that do increased volumes of these mortgages.
[Ken Harney: Saying yes to a new car can make a mortgage lender more likely to say no]
“So this emphasizes the importance of shopping,” Stevens said in an interview. If the first couple of lenders say no, mortgage applicants should keep shopping until they locate a lender that — encouraged by the new flexibility from FHA — says yes.
Why is the government opening FHA’s doors wider for buyers who previously would have been rejected? In large part it’s because just about everybody — including Federal Reserve Chair Janet Yellen, prominent economists and financial experts — agrees that credit standards have gotten too strict in the years since the bust, especially given the recent payment performances of borrowers.
Brian Chappelle, a principal at the housing consulting firm Potomac Partners and a nationally known expert on FHA, told me via e-mail that mortgages with low FICO scores originated during the past two years “are performing better than the total mix of FHA business [including loans with much higher scores] from 1999 through 2011.” Serious delinquencies of 90 days or more where applicants had FICOs below 640 were at just 1.82 percent as of June 30.
The takeaway here: Just because your credit reports and scores continue to bear the wounds of the recession and financial crisis, don’t assume you can’t buy a house. Shop aggressively among FHA lenders in the coming weeks and months, and you’re likely to find a better reception than you might have feared.